New dashboard with insights into performance of Cirrus Runners
This month we are celebrating one year since launching Cirrus Runners — managed Apple Silicon infrastructure for your GitHub Actions. During the last 12 months we ran millions of workflows for our customers and now ready to share some insights into price performance of them for our customers.
One of the key difference with Cirrus Runners is how they are getting billed for. Customers purchase Cirrus Runners via monthly subscription that costs $150 per each Cirrus Runner. Each runner can be used 24 hours a day 7 days a week to run GitHub Actions workflows for an organization. If there are more outstanding jobs than available runners then they are queued and executed as soon as there is a free runner. This is different from how GitHub-managed GitHub Actions are billed for — you pay for each minute of execution time.
The benefit of a fixed price is that you can run as many jobs as you want without worrying about the cost. The downside is that you need to make sure that you are using your runners efficiently. This is where the new dashboard comes in handy.
But first, let's see theoretically the lowest price per minute of a Cirrus Runners. If you run 24 hours a day 7 days a week then you will get 43,200 minutes of execution time per month. This means that the price per minute is $0.0035 if your runners utilization is 100%. But even if your engineering teams is located in a single time zone and works 8 hours a day 5 days a week then you will get 9,600 minutes of execution time per month which comes down to $0.015 per-minute. This is still more than 10 times cheaper than recently announced Apple Silicon GitHub-manged runners that cost $0.16 per minute.
Now lets take a look at the new Cirrus Runners dashboard of a real customers that run their workflows on Cirrus Runners and practically pushing the price performance pretty close to the theoretical minimum.
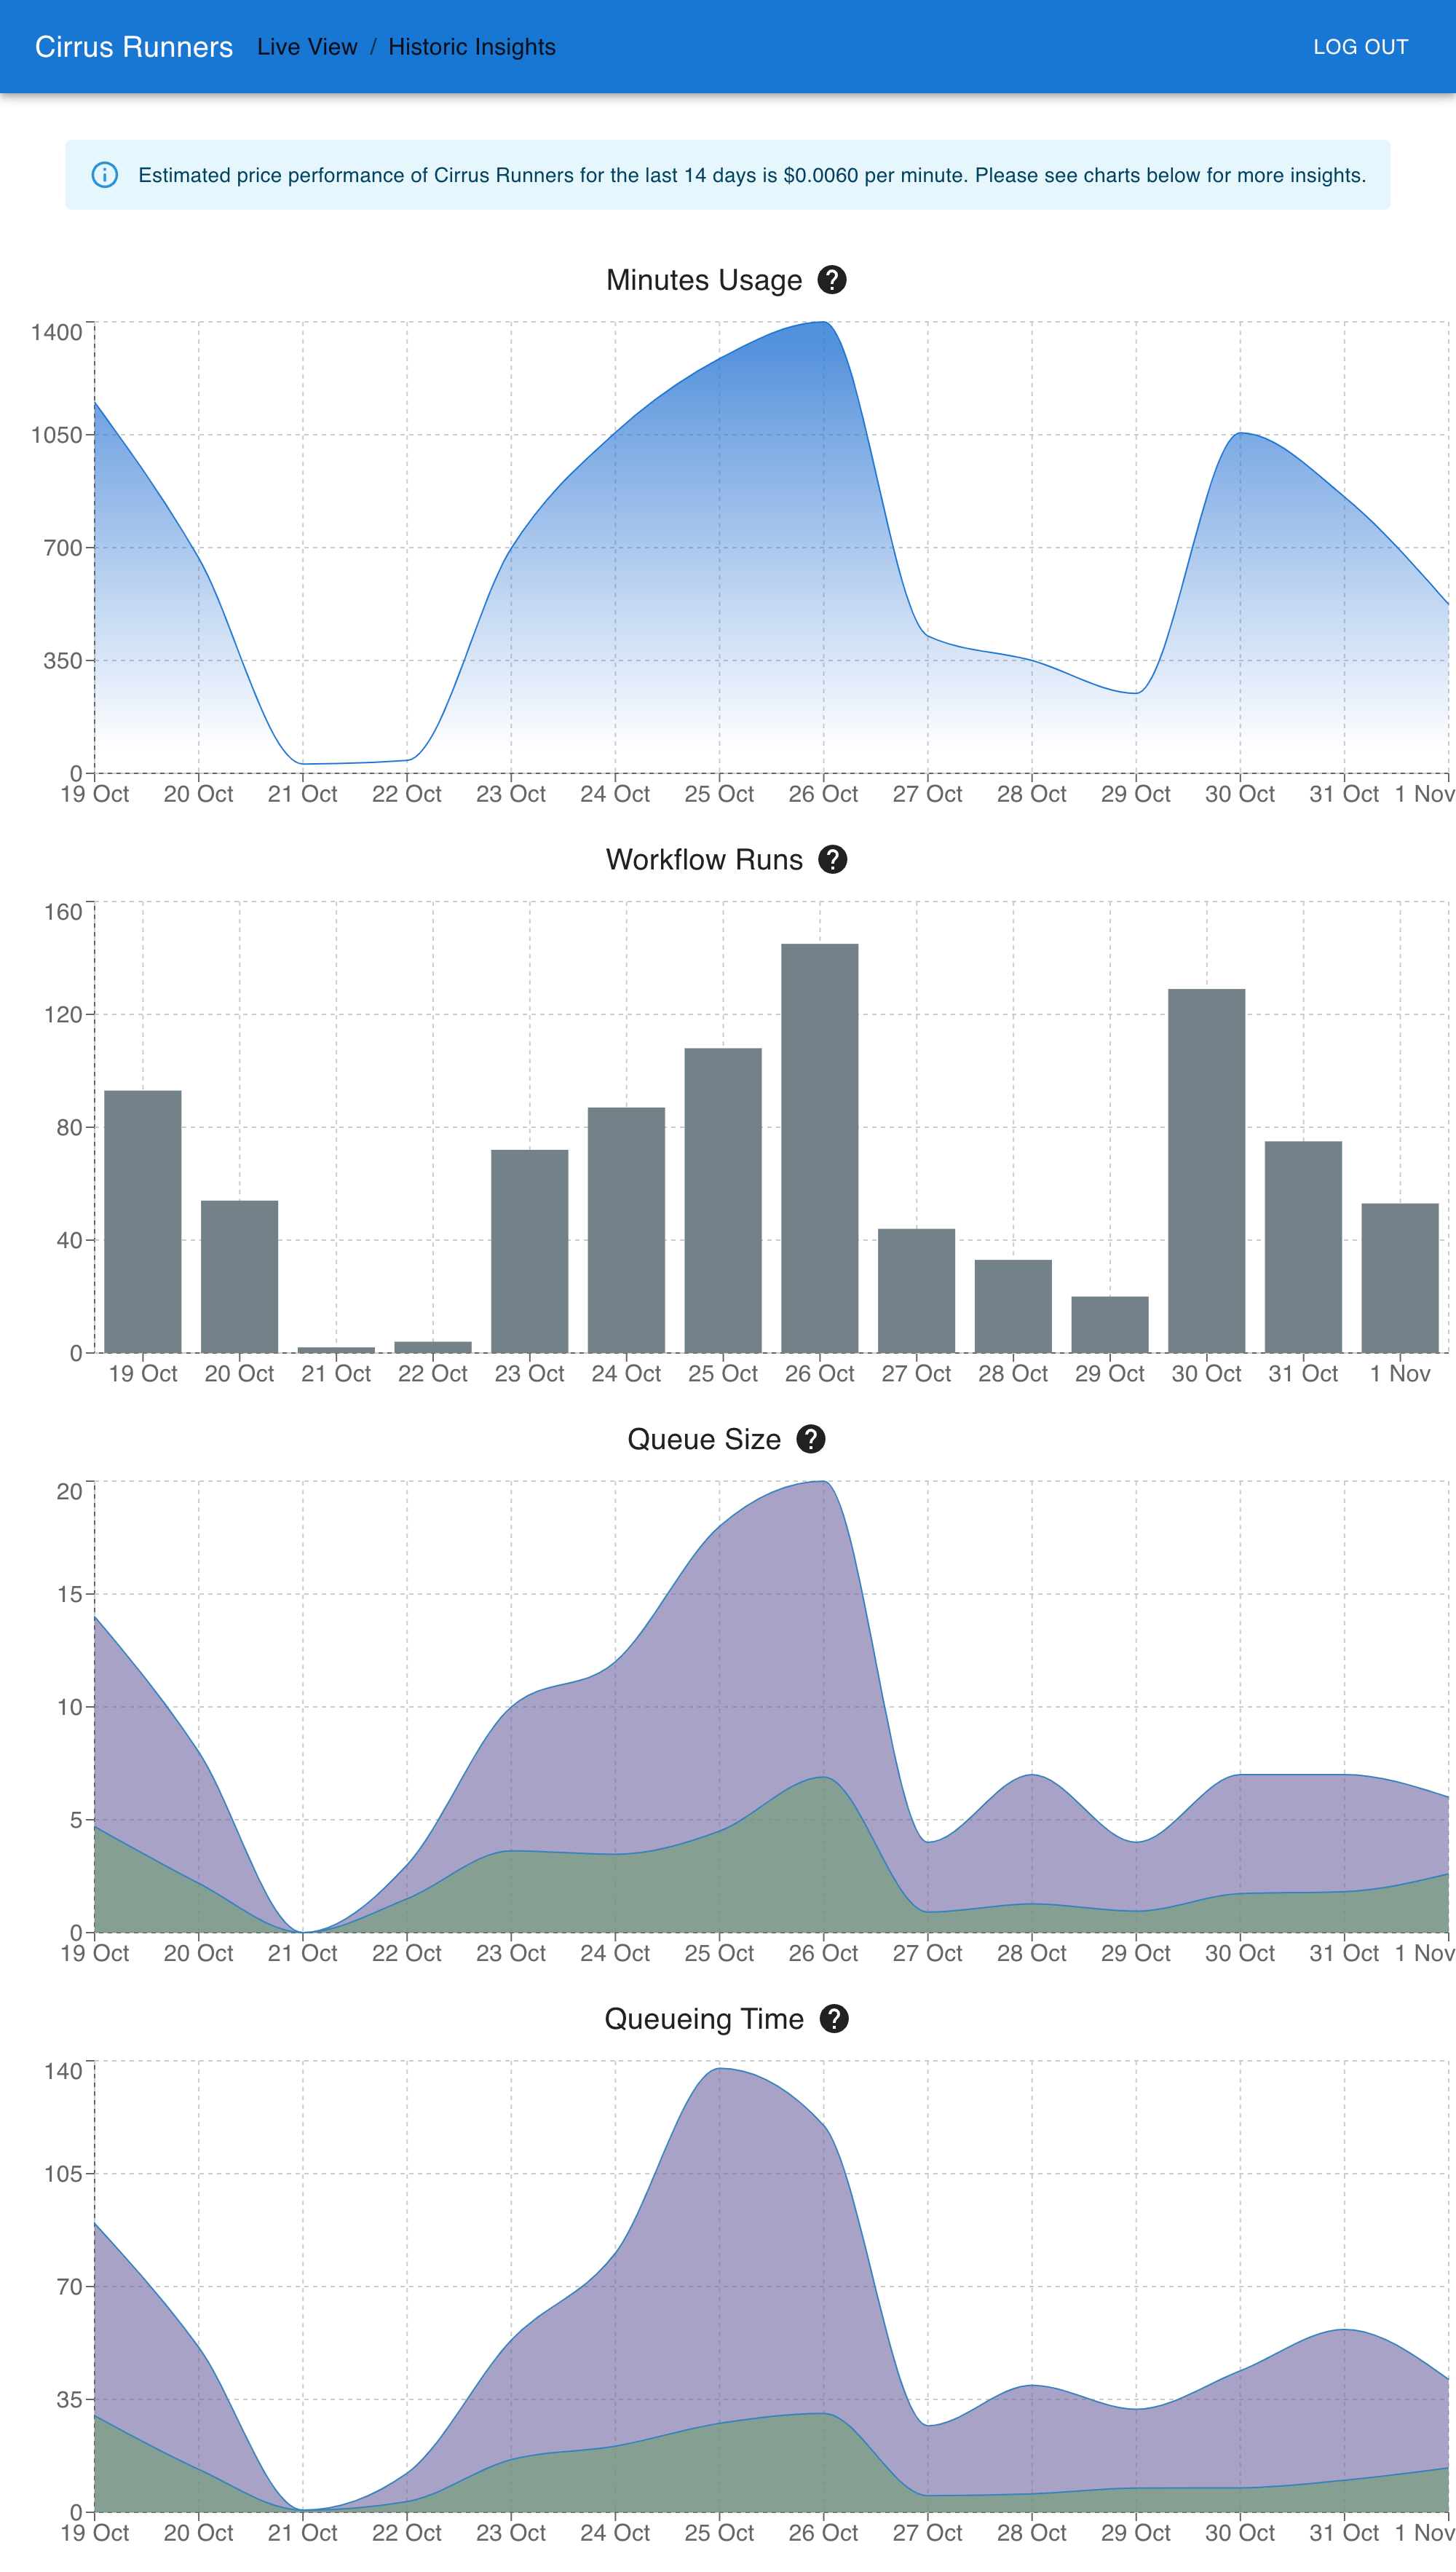
As you can see above Cirrus Runners Dashboard focuses on 4 core metrics:
- Minutes Used — overall amount of minutes that Cirrus Runners were executing jobs.
- Workflow Runs — absolute number of workflow runs that were executed on Cirrus Runners.
- Queue Size — number of jobs that were queued and waiting for a free Cirrus Runner.
- Queue Time — average time that jobs were waiting in the queue.
In this particular example price performance of Cirrus Runners is $0.006 per minute which is 2 times more than the theoretical minimum and 26 times better than GitHub-managed Apple Silicon runners. But this is a extreme example, looking at queue time and queue size we can see that the downside of such great price performance is that jobs are waiting in the queue on average around 5 minutes.
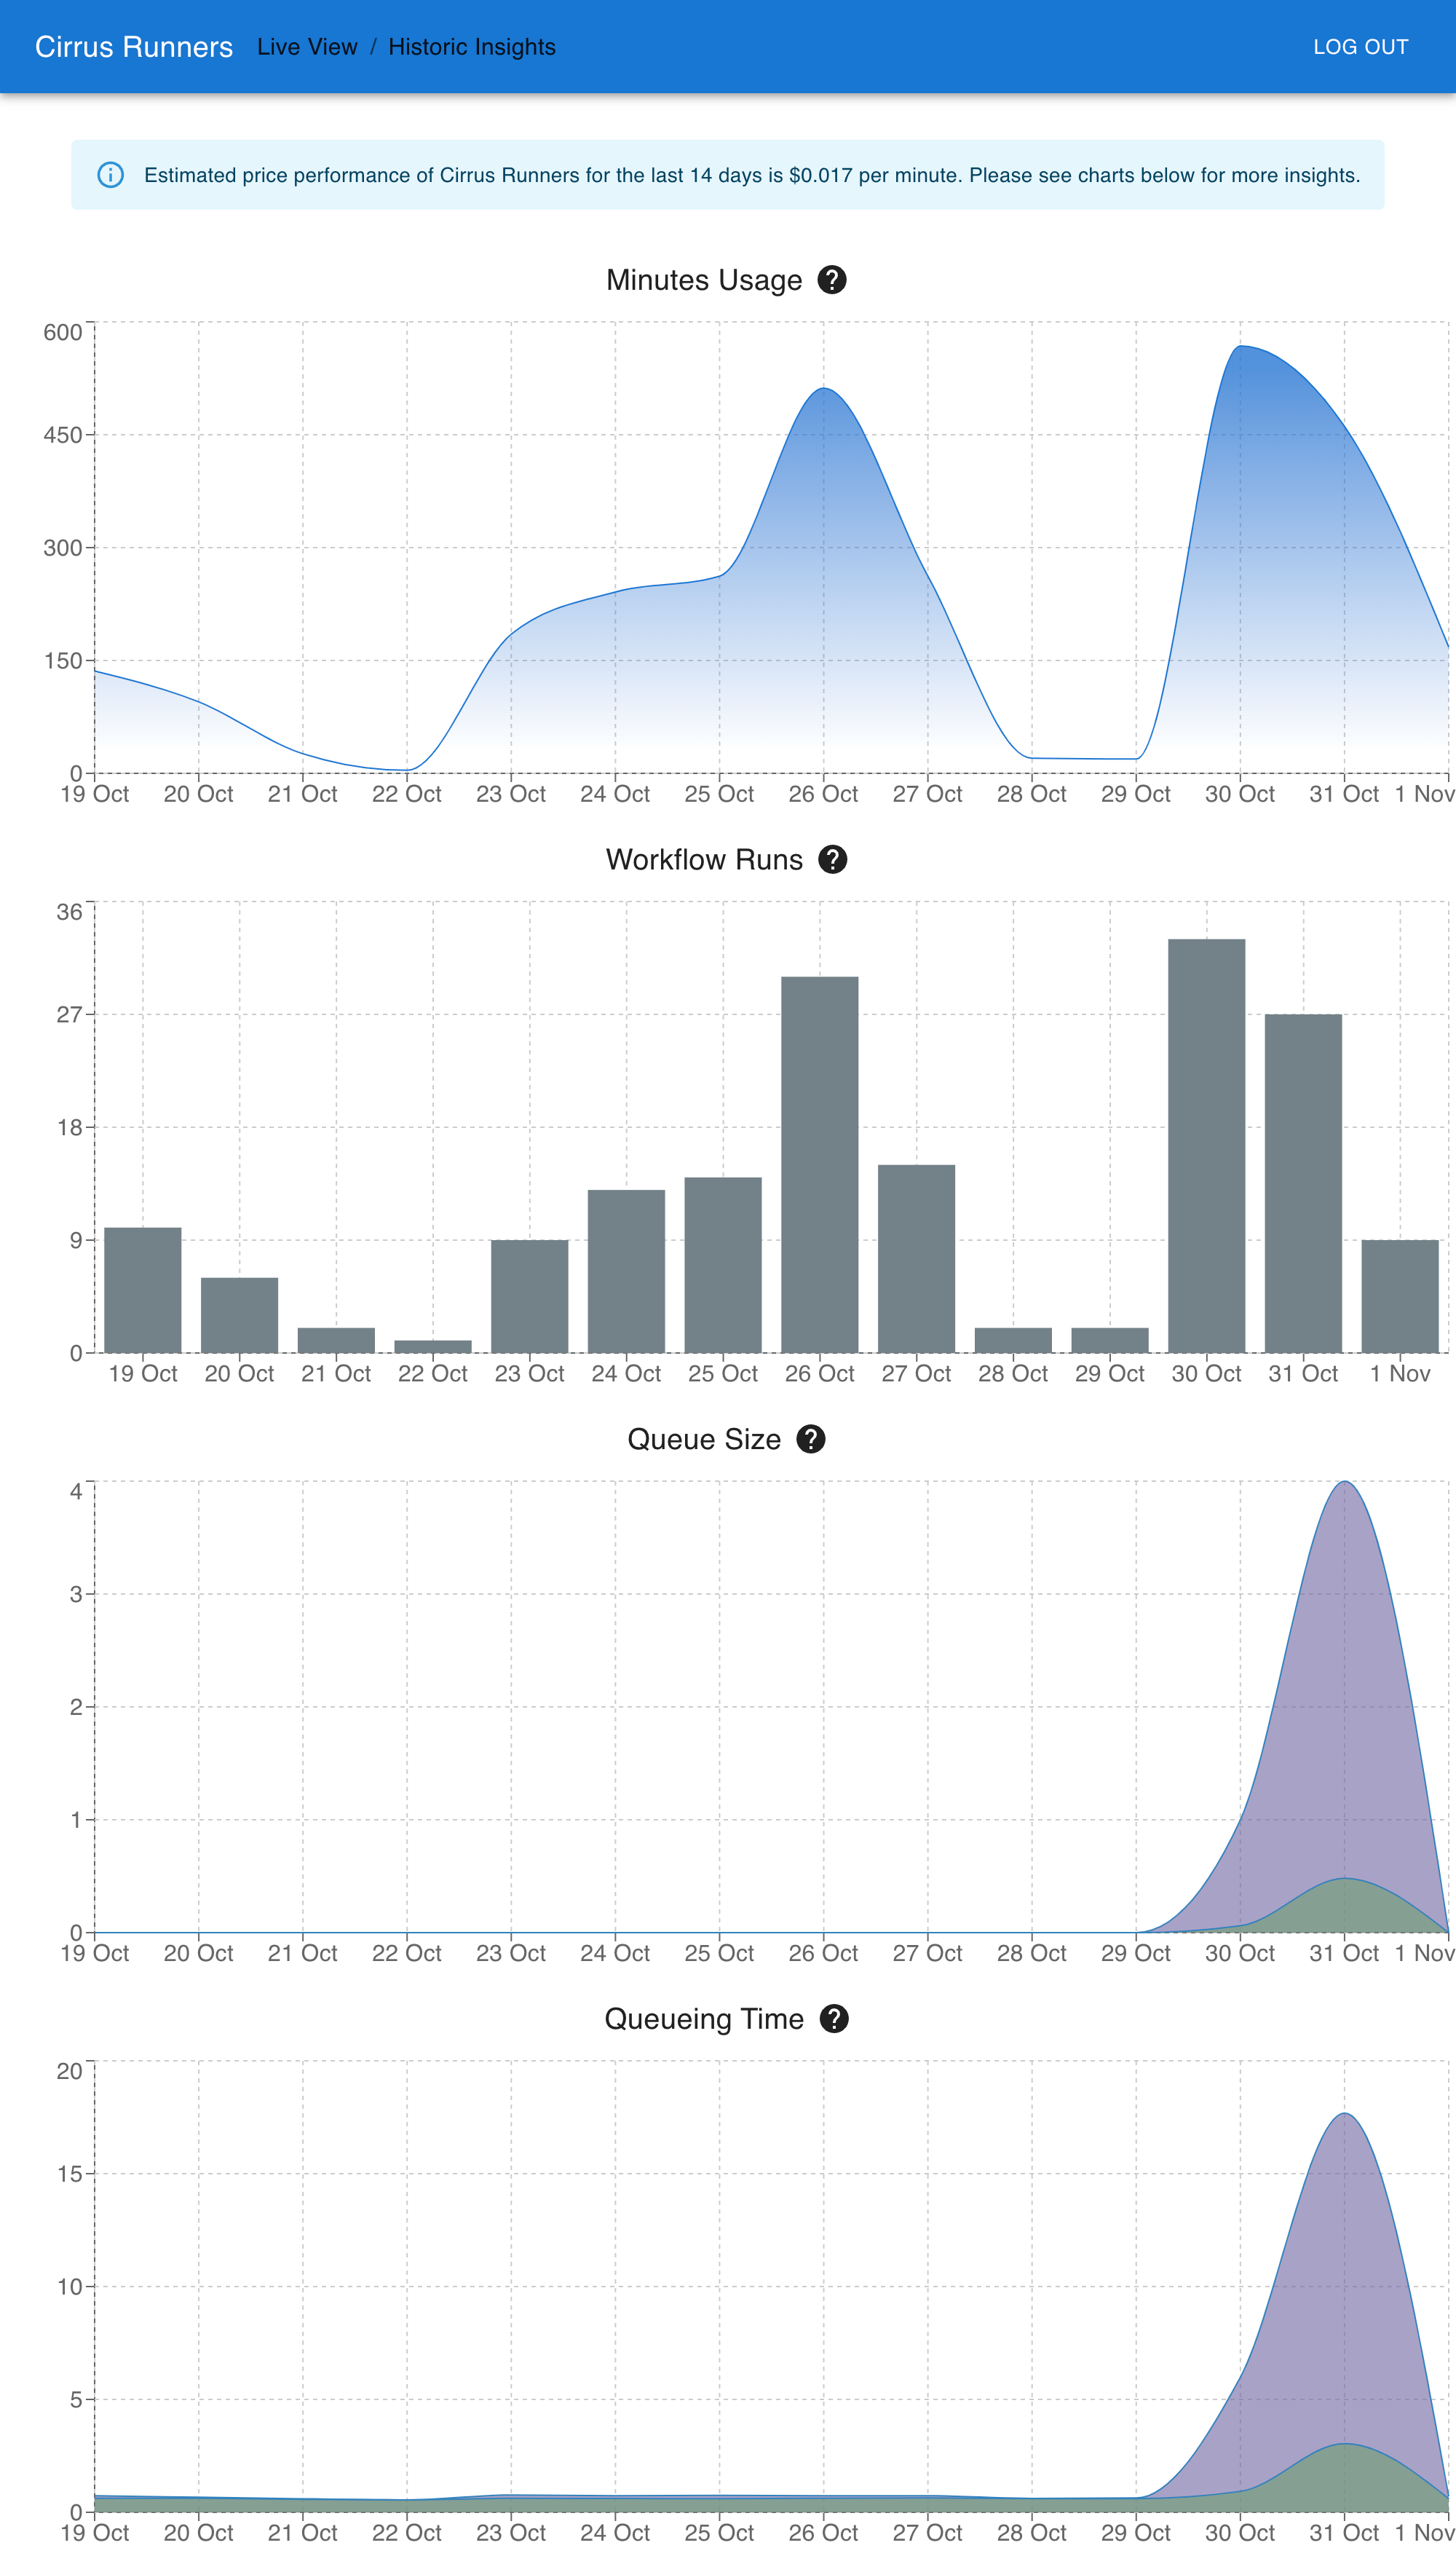
Here is another example of Cirrus Runners Dashboard for a different customer that has a slightly higher price performance of $0.017 per minute but at the same time doesn't experience queue time at all. Note that $0.017 is still 10 times cheaper than GitHub-managed Apple Silicon runners.
Conclusion
Having a fixed price for Cirrus Runners is a great way to save money on your CI/CD infrastructure and just in general have predictable budged. But it requires keeping the balance between price per minute and queue time. Cirrus Runners Dashboard helps you to keep an eye on this balance and make sure that you are getting the most out of your Cirrus Runners.